
Every year there is more data that marketing and communications leaders can consider when making strategic marketing decisions.
Without a clear understanding of data and what data matters, I find that having access to all the data can be overwhelming and honestly somewhat paralyzing.
That is why I put together this list as part of a pre-conference workshop Melissa Farmer Richards and I co-presented at AMA last fall. My goal was to help the next generation of professionals better assess what data they should be using in their work.
Since attendees noted it was incredibly helpful, I wanted to share the information with all of you as well.
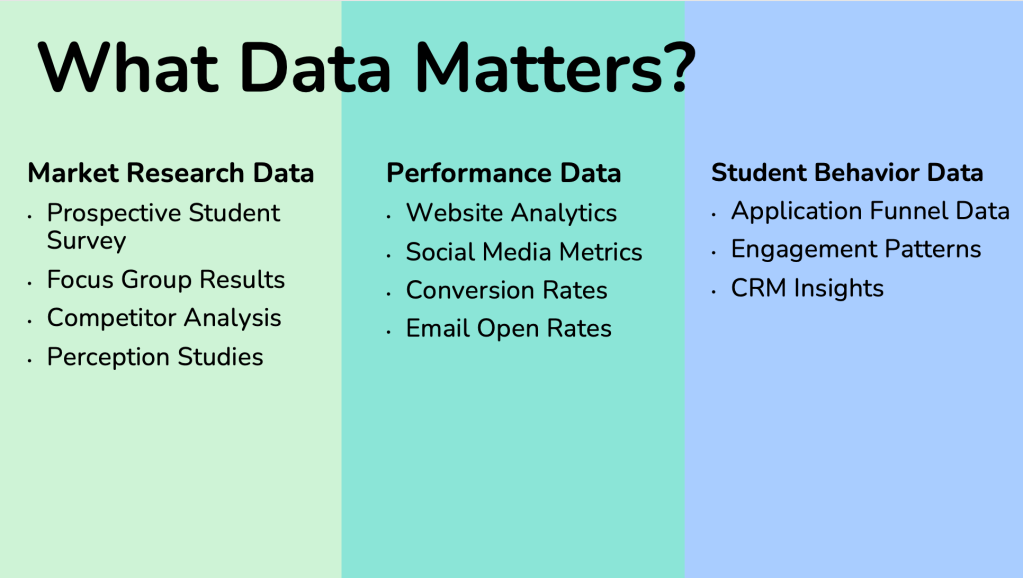
Student Behavior Data – Outcomes
I consider behavior data to be outcomes data because it is a measure of what the target audience is doing because of the actions your team has taken. In the PRSA model, this is the “do” that you want your audience to achieve.
Chances are, you have easy access to much of this data. This is good, but it also comes with a word of caution. It can be tempting to look at it daily, weekly, or monthly (and in yield season there is definitely a case for that), but the best way to spot larger trends in this data is to review it quarterly.
Understanding this data and reviewing it quarterly can help your team make smart decisions about strategy adjustments that may be needed but would be difficult to discern in a weekly review. Making strategy decisions off weekly analysis could result in a more knee-jerk approach and ultimately not achieve the results you are hoping for.
Application funnel data – This includes understanding the numbers related to your applications, admitted students, and even abandoned applications. Looking at each of these numbers quarterly can help you with a myriad of insights. First, are your application numbers trending in the right direction? This is a great way to assess awareness of your institution. However, awareness doesn’t measure fit. That’s where your admitted student rate becomes important. Having lots of applicants who are not a fit for your school could show up in your admitted rate. If you’re seeing a drop in this number, it might be a sign to rethink how you’re marketing to students. On the flip side, if this number is higher than it should be, it might suggest that you look at yielding students. If you’re admitting students who are never likely to go, you might need to adjust your marketing to better align with your ideal student and save resources. Finally, abandoned applications, can tell you whether your application is too challenging and where potential barriers might exist for students. Looking at this can help you remove red tape for potential students.
Engagement rates – A phrase at UA Little Rock (on the development side) is engagement = money. I think the phrase can be modified for students to be engagement = students. The students who are engaging in your events, emails, and website visits are more likely to attend. This can help you in two specific ways. First, look at the events, emails and website pages that have low engagement. What can you do to make that content work for the students better? It could involve making it more personal, making it more timely, or adjusting in another way. However, it’s important to assess quarterly why they’re low engagement. A second way to use engagement rates is a means of scoring your students. Chances are, your teams are taxed with trying to support everyone. If there are heavily engaged students, they may need fewer additional physical touch points (people, swag, print materials) to convert from a prospective student to an actual student. That strategy can help the team with burnout and can also help your office stretch (likely) limited resources.
CRM Insights – The final section is insights from the CRM. The great part about having a CRM is that it tracks the communication history and inquiry responses from students. This allows your team to assess quarterly what is effective. By digging into what messages are problematic and what continual questions keep coming up, you’re able to spot trends and work to make the communication flow and the other content (websites, print, event days) address these concerns before students have to ask the questions or get emails that aren’t helpful. By proactively addressing these patterns, you’re not only refining your messaging, but you’re enhancing the student experience. Using this data can help you better anticipate needs, reduce friction, and build a more seamless journey from inquiry to enrollment.
Other Thoughts
Thank you for joining me for the last three weeks on this data deep-dive. I hope this data primer has been helpful and will be of use as you think about ways to integrate data.
If there’s been a piece of data that you find incredibly important that I haven’t referenced, I’d love to hear about it as well!
